Calibration of predicted probabilities
In one sentence
Calibration describes how closely predicted probabilities agree with observed outcome frequencies in a defined population and time period.
The intuition
If a weather service says “20% chance of rain” on many comparable days, you would hope about one in five turns rainy. It can predict which days are wetter without getting that percentage right. Cancer-risk models face the same distinction between ordering and probability agreement. The weather analogy does not supply evidence about a patient's outcome.
How it works
Calibration compares predictions with observed outcomes at the same defined horizon. Grouped observations or a smooth calibration curve can show whether predictions are systematically too high, too low or too extreme. Finite samples create uncertainty; a rough comparison is not an exact verdict.
Calibration in the large compares the overall predicted event frequency with the observed frequency. That average can look right while predictions for lower- and higher-risk people remain wrong. A calibration slope examines how the strength of predictions compares with outcomes under a specified model. A slope of one and a suitable intercept are useful targets, but they do not guarantee agreement everywhere. Riley and colleagues: external validation.
Changing treatment era, eligibility, measurement or baseline event frequency can change calibration. Recalibration updates parts of a model to fit a new setting; it creates a version that needs its own evaluation. A familiar calculator name cannot stand in for that record. TRIPOD+AI reporting guidance.
Why it matters in cancer
A person may use a predicted recurrence probability to understand a discussion. Before reading it as a reliable probability, check the model's endpoint, time origin, inputs and relevant independent validation. Even good calibration does not establish that choosing treatment with the model improves outcomes.
Worked example
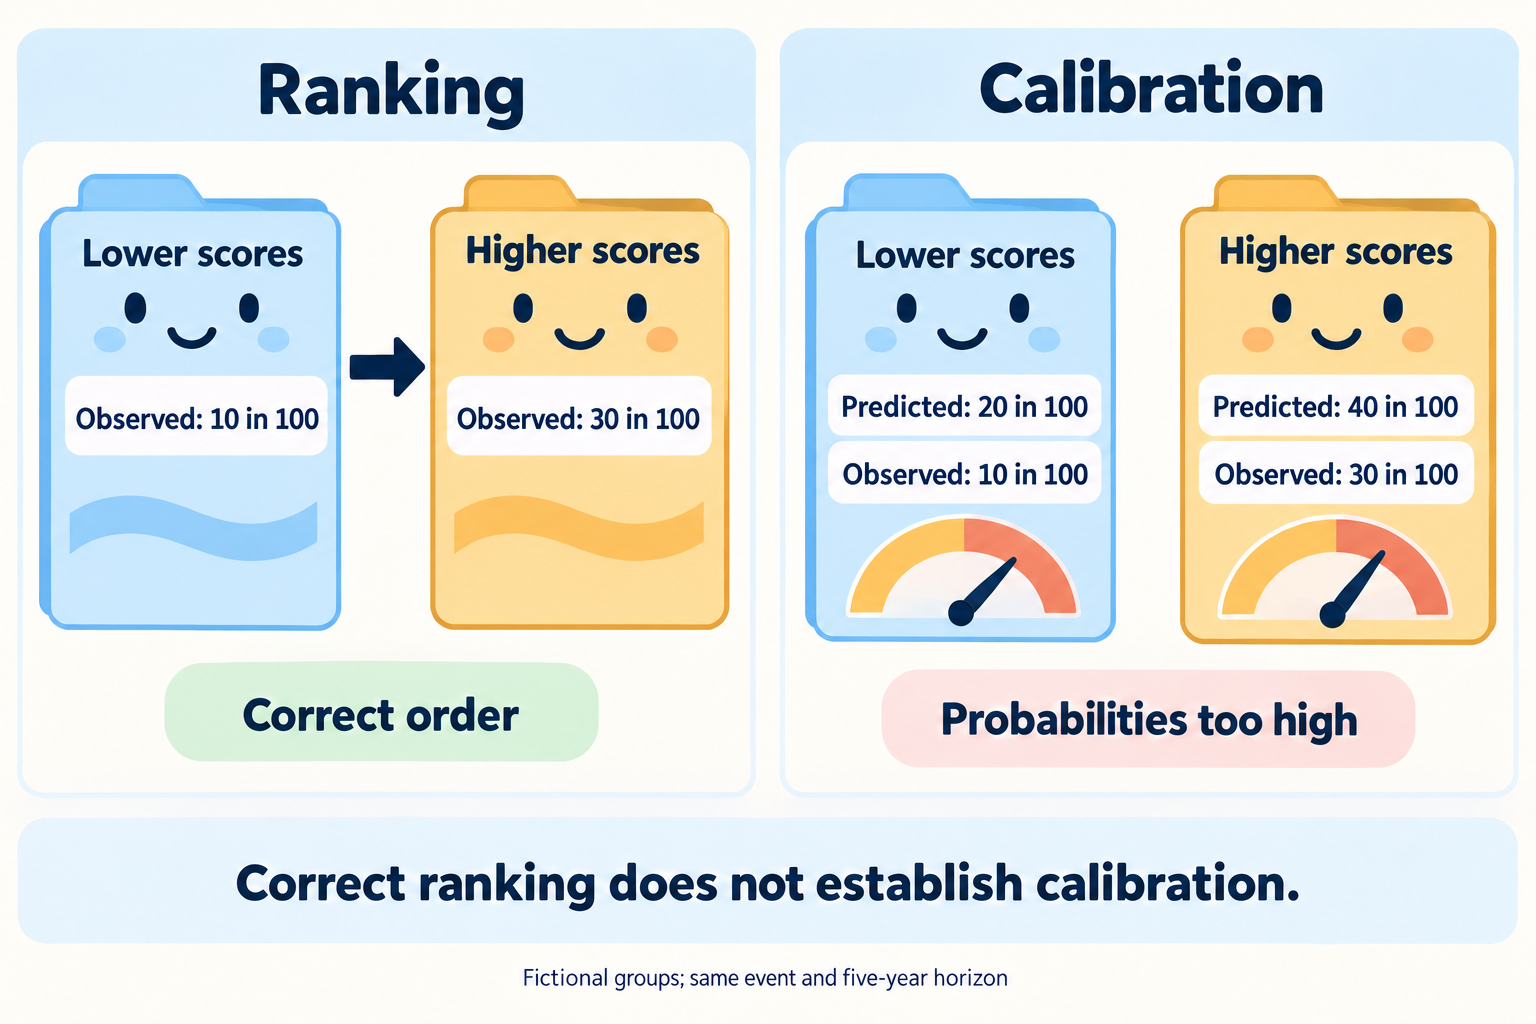
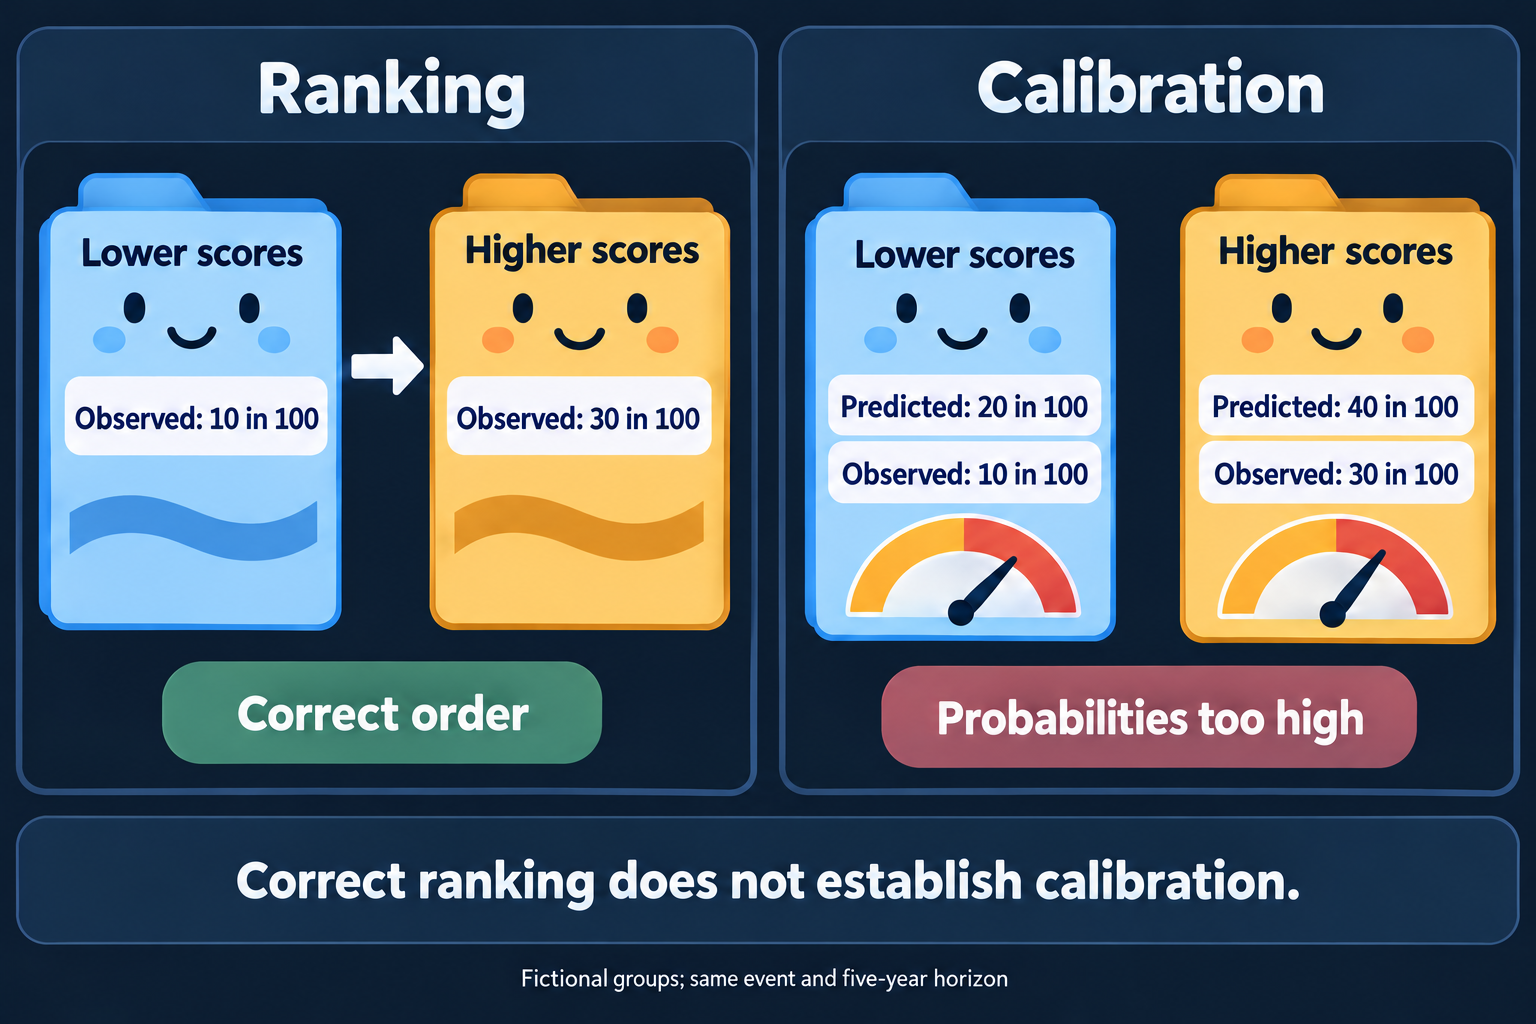
Correct ordering can coexist with probabilities that are too high; the fictional counts below share one five-year endpoint.
Two equally sized fictional groups each contain 100 people assessed for the same event by five years, with complete follow-up.
| Group | Model's predicted risk | Observed events |
|---|---|---|
| Lower scores | 20% | 10 of 100 |
| Higher scores | 40% | 30 of 100 |
The model distinguishes the groups in the right direction. Both percentages overstate their observed frequencies. Overall it predicts 60 events but observes 40. These invented counts illustrate poor agreement; they do not measure any cancer model's performance.
Now imagine predictions of 10% and 50%, with 20 and 40 events in those groups. Both the predicted and observed total are 60 events, yet each group is miscalibrated. Checking only the overall average would miss this.
Common confusions
- A high AUC does not establish calibration.
- Calibration belongs to a population, endpoint and horizon, not every future setting.
- A calibrated 20% prediction cannot tell which particular person will have the event.
- A narrow range displayed by software is not evidence that model or input uncertainty is small.
- A model can agree with observed frequencies while offering no useful treatment decision.
Try it
A calculator was validated before a new treatment became routine. Does its original validation settle the probabilities under the new treatment?
Answer: No. The new treatment context needs evaluation. Do not repair the output by multiplying unrelated trial effect estimates.
Related concepts
Sources and scope
Source check: October 9, 2026. Examples are fictional; expert and learner review remain pending.
- Riley et al., 2024: external validation and calibration evaluation.
- Van Calster et al., 2019: calibration definitions and evaluation.
- TRIPOD+AI, 2024: required prediction-model reporting.